bp-energy-outlook-2017 key issue 사항입니다.
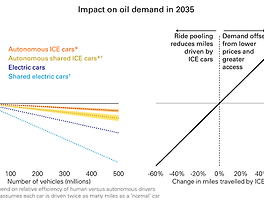
• Impact of electric cars on oil demand
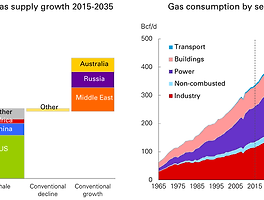
• Oil supplies in a world of increasing abundance
• Implications of the growth of LNG for the global gas market
• China’s changing energy landscape
• 전기 자동차가 석유 수요에 미치는 영향
• 풍요 로움의 세계에서 석유 공급
• 세계 가스 시장을위한 LNG 성장의 시사점
• 중국의 변화하는 에너지 환경
Rising prosperity boosts car ownership in emerging markets as efficiency targets & lower battery costs spur electrification

Fuel demand for use in cars continues to rise despite efficiency improvements and EV switching
• Almost all of this growth is in emerging markets, as rising incomes and improving road infrastructure boost car ownership. The non-OECD fleet triples over the Outlook from 0.4 billion cars to 1.2 billion. Overall, global demand for car travel roughly doubles over the Outlook.
• The number of electric cars also rises significantly, from 1.2 million in 2015 to around 100 million by 2035 (6% of the global fleet). Around a quarter of these electric vehicles (EVs) are Plug-In Hybrids (PHEVs), which run on a mix of electric power and oil, and three quarters are pure Battery Electric Vehicles (BEVs).
• A key driver of the pace at which EVs penetrate the global car fleet is the extent to which fuel economy standards are tightened. But EV penetration will also depend on a number of other factors including: (i) the pace at which battery costs continue to fall; (ii) the size and durability of subsidies and other government policies supporting EV ownership; (iii) the speed at which the efficiency of conventional vehicles improves; and crucially on (iv) consumer preferences towards EVs.
• 세계 자동차 보유 대수는 2015 년 9 억 대에서 2035 년 18 억대로 두 배가됩니다.
• 증가하는 수입과 도로 인프라 개선으로 자동차 소유가 늘어남에 따라이 모든 성장의 대부분은 이머징 마켓에 있습니다. OECD가 아닌 국가는 4 억대에서 12 억대로 3 배가 넘는다. 전반적으로, 자동차 여행에 대한 전세계 수요는 전망보다 대략 두 배입니다.
• 전기 자동차의 수도 2015 년 120 만대에서 2035 년에는 약 1 억대로 세계적인 차량의 6 %에 이른다. 이 전기 자동차 (EV)의 약 4 분의 1은 전력과 오일이 혼합 된 플러그인 하이브리드 (Plug-In Hybrids, PHEV)이며 3/4은 순수한 배터리 전기 자동차 (BEV)입니다.
• EV가 글로벌 자동차 함대에 침투하는 속도의 주요 동력은 연비 표준이 강화되는 범위입니다. 그러나 EV 보급률은 (i) 배터리 비용이 지속적으로 떨어지는 속도; (ii) 보조금의 규모와 내구성 및 EV 소유권을 지원하는 기타 정부 정책; (iii) 종래의 차량의 효율이 향상되는 속도; (iv) EV에 대한 소비자의 선호도에 결정적인 영향을 미친다.
Fuel demand for use in cars continues to rise despite efficiency improvements and EV switching

There is an abundance of oil resources with known oil resources dwarfing future consumption needs
• All else equal, a doubling in the demand for car travel over the Outlook would lead to a doubling in the liquid fuel demand from cars.
• But improvements in fuel efficiency reduce this potential growth significantly (by 17 Mb/d) as manufacturers respond to stricter vehicle emission standards. An average passenger car is expected to achieve almost 50 miles per US gallon in 2035, compared with less than 30 MPG in 2015 - a faster rate of efficiency improvement than in the past.
• The growth of electric cars also mitigates the growth in oil demand, but the effect is much smaller: the 100 million increase in electric cars reduces oil demand growth by 1.2 Mb/d. By comparison, this is around a tenth of the impact of the gains in vehicle efficiency.
• Overall, the increase in demand for car travel from the growing middle class in emerging economies overpowers the effects of improving fuel efficiency and electrification, such that liquid fuel demand for cars rises by 4 Mb/d - around a quarter of the total growth over the Outlook.
• 2015 년에 자동차는 19Mb / d의 액체 연료 수요를 차지하여 전세계 수요의 1/5을 차지했습니다.
• 그 밖의 모든 것이 같으면 아웃룩에 대한 자동차 여행 수요가 두 배로 증가하면 자동차의 액체 연료 수요가 두 배가됩니다.
그러나 연료 효율성 향상은 제조업체가보다 엄격한 자동차 배기 가스 규제에 대응할 때이 잠재적 성장을 현저하게 줄입니다 (17Mb / d). 평균 승용차는 2015 년에 미국 갤런 당 거의 50 마일을 달성 할 것으로 예상되는 반면, 2015 년에는 30 MPG 미만으로 과거보다 효율성이 향상됩니다.
• 전기 자동차의 성장은 석유 수요의 증가를 완화 시키지만 영향은 훨씬 적습니다. 전기 자동차의 1 억 대 증가는 석유 수요 증가를 1.2Mb / d 감소시킵니다. 비교해 보면, 이것은 차량 효율의 향상으로 인한 충격의 10 분의 1 정도입니다.
• 전반적으로 신흥 경제에서 성장하는 중산층의 자동차 여행 수요가 늘어남에 따라 연료 효율성 및 전기 개선 효과가 압도적으로 높아져 자동차의 액체 연료 수요가 4Mb / d 증가합니다. 전망.
There is an abundance of oil resources with known oil resources dwarfing future consumption needs

likely consumption of oil out to 2050 and beyond.
• Global proved oil reserves (the narrowest category of resources) have more than doubled over the past 35 years: for every barrel of oil consumed more than two new barrels have been discovered.
• Technically recoverable oil, a broader category which aims to measure those
resources that could be extracted using today’s technology, are estimated to be
around 2.6 trillion barrels. Around 1.7 trillion barrels (65%) of those resources are located in the Middle East, CIS and North America.
• This abundance of oil resources contrasts with slowing growth of oil demand.
Cumulative oil demand out to 2035 is expected to be around 0.7 trillion barrels, significantly less than recoverable oil in the Middle East alone.
• Looking out further to 2050, under most scenarios (see pages 88 to 89) cumulative
global oil demand amounts to less than half of today’s technically recoverable oil
resources.
• 풍부한 석유 자원이 있습니다 : 오늘날 알려진 자원은 세계의 왜소합니다
오일의 2050 년 이후 소비 가능성.
• 세계적으로 증명 된 석유 매장량 (가장 좁은 범주의 자원)은 지난 35 년 동안 두 배 이상 증가했습니다 : 소비 된 석유 1 배럴 당 2 배 이상의 새로운 배럴이 발견되었습니다.
• 기술적으로 복구 가능한 오일, 오일을 측정하는 것을 목표로하는보다 광범위한 카테고리
오늘날의 기술을 사용하여 추출 할 수있는 자원은
약 2.6 조 배럴. 이들 자원의 약 1.7 조 배럴 (65 %)은 중동, CIS 및 북미에 위치하고 있습니다.
• 이러한 풍부한 석유 자원은 석유 수요의 성장 둔화와 대조됩니다.
2035 년까지 누적 석유 수요는 약 0.7 조 배럴로 중동 만의 복구 가능한 석유보다 훨씬 적을 것으로 예상됩니다.
• 대부분의 시나리오 (페이지 88에서 89 참조) 누적
세계적인 석유 수요는 오늘날의 기술적으로 복구 가능한 석유 자원의 절반에도 미치지 못합니다.
Abundance of oil resources may cause a change in behaviour with low-cost producers increasing their market share

LNG supplies grow strongly led by US and Australia with demand remaining concentrated in Asia
• Although costs vary significantly within resource categories, the majority of the lowest cost resources are located in large, conventional onshore oilfields, particularly in the Middle East and Russia. This is followed by the best US tight oil plays.
• We assume the abundance of oil resources prompts a change in behaviour, such that production from Middle East OPEC, Russia and the US increases disproportionately over the Outlook, with its share growing from 56% today to 63% in 2035.
• The extent to which global supply behaviour changes is a key source of uncertainty and depends on: (i) the cost and feasibility of low-cost producers increasing supply materially over the Outlook; (ii) the extent to which prices respond to increased supplies of low-cost oil and the implications this has for producers’ economies; and (iii) the ability of higher-cost producers to compete by varying their tax and royalty regimes.
• 석유 수요가 둔화 될 것이라는 전망과 결합 된 풍부한 석유 자원은 세계 석유 공급의 변화를 촉발 할 수 있습니다. 특히 저비용 생산 업체는 시장 점유율을 높이기 위해 경쟁 우위를 사용할 수 있습니다.
• 자원 범주 내에서 비용이 크게 다르지만 대부분의 가장 저렴한 비용 자원은 대규모의 기존 육상 유전, 특히 중동 및 러시아에 위치합니다. 이것은 최고의 미국 타이트 오일 연극이 뒤 따른다.
• 우리는 석유 자원이 풍부한 상황에서 OPEC, 러시아, 미국 중동 지역의 생산량이 현재의 56 %에서 2035 년에는 63 %로 증가하는 등 전망에 비해 불균형 적으로 증가하는 행동 변화를 촉구합니다.
• 글로벌 공급 행동이 변화하는 정도는 불확실성의 핵심 원천이며 다음에 달려있다. (i) 저비용 생산자가 전망보다 실질적으로 공급을 증가시키는 비용 및 실현 가능성; (ii) 가격이 저비용 석유의 공급 증가에 반응하는 정도와 이것이 생산국 경제에 미친 영향 (iii) 고비용 생산자가 세금 및 로열티 제도를 변화시킴으로써 경쟁 할 수있는 능력.
LNG supplies grow strongly led by US and Australia with demand remaining concentrated in Asia

LNG’s share in traded gas increases sharply leading to increasing integration across gas markets
• Nearly a third of this growth occurs over the first four years of the Outlook as a series of projects currently under development are completed. After a temporary lull while this initial wave of LNG supplies is absorbed, growth is assumed to resume at a more moderate pace.
• There is a risk that this second wave of LNG supply growth is slow to materialise causing a temporary period of tightness within LNG supplies.
• Asia remains the largest destination for LNG. China, India and other Asian countries all increase their demand for LNG, helping gas to grow faster than either oil or coal in each of these economies.
• Europe also makes increasing recourse to LNG to help meet the growing gap caused by declines in its domestic production (see pages 34 to 35).
• 글로벌 LNG 공급은 미국 (19 Bcf / d) 및 호주 (13 Bcf / d)의 성장을 주도하여 전망을 통해 강력하게 증가합니다.
• 현재 개발중인 일련의 프로젝트가 완료되면서 Outlook의 첫 4 년간이 성장의 거의 1/3이 발생합니다. LNG 공급의 초기 물결이 흡수되는 동안 잠시 동안 잠잠해진 후, 성장은보다 완만 한 속도로 재개 될 것으로 추정됩니다.
• LNG 공급량 증가의 두 번째 물결이 느려져 LNG 공급 장치 내에서 일시적인 긴장감을 유발할 위험이 있습니다.
• 아시아는 LNG의 가장 큰 목적지이다. 중국, 인도 및 다른 아시아 국가들은 모두 LNG에 대한 수요를 늘려 이들 각국의 석유 나 석탄보다 가스가 빠르게 성장할 수 있도록 도와줍니다.
• 유럽은 또한 국내 생산량 감소로 인한 격차를 해소하기 위해 LNG에 대한 의존도를 높이고 있습니다 (34 ~ 35 페이지 참조).
LNG’s share in traded gas increases sharply leading to increasing integration across gas markets

China’s energy needs are changing as it adjusts to a more sustainable growth path
• The significance of the growing importance of LNG-based trade is that, unlike pipeline gas, LNG cargoes can be redirected to different parts of the world in response to regional fluctuations in demand and supply. As a result, gas markets are likely to become increasingly integrated across the world.
• In particular, if prices move further apart than is warranted by transportation costs, there will be an incentive for LNG supplies to be redirected until prices move back into line.
• Australian LNG supplies are normally likely to be absorbed within Asia. US LNG exports are likely to be more diversified, providing the marginal source of gas for markets in Europe, Asia and South & Central America. As such, US gas prices are likely to play a key role in anchoring gas prices in a globally integrated market.
• The development of a deep and competitive LNG market is likely to cause long-term gas contracts to be increasingly indexed to spot LNG prices.
• LNG는 파이프 라인 가스 거래보다 7 배 빠르게 성장하므로 2035 년까지 전 세계 거래되는 가스의 약 절반을 차지합니다 (현재 32 %).
• LNG 기반 무역의 중요성이 커짐에 따라 파이프 라인 가스와 달리 LNG화물은 수요와 공급의 지역적 변동에 대응하여 전세계 다른 지역으로 리디렉션 될 수 있습니다. 결과적으로, 가스 시장은 전 세계적으로 점점 더 통합 될 것입니다.
• 특히 물가가 교통 비용보다 더 많이 움직인다면, 가격이 다시 정상화 될 때까지 LNG 공급원이 방향을 바꿀 수있는 인센티브가있을 것이다.
• 호주 LNG 공급은 일반적으로 아시아 지역에서 흡수 될 것입니다. 미국의 LNG 수출은 유럽, 아시아, 남미 및 중미 시장의 가스 공급원을 제한함으로써보다 다양 화 될 것입니다. 따라서 미국의 가스 가격은 글로벌 통합 시장에서 가스 가격을 고정시키는 데 중요한 역할을 할 것으로 보인다.
• 치열하고 경쟁이 치열한 LNG 시장의 개발은 장기 가스 계약이 LNG 가격을 찾기 위해 점점 더 색인화 될 수 있습니다.
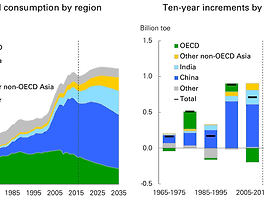
China’s energy needs are changing as it adjusts to a more sustainable growth path

• China is the world’s largest consumer of energy and has been the most important
source of growth for global energy over the past 20 years. But as China adjusts to a more sustainable pattern of growth, its energy needs are likely to change.
• China’s demand for energy is projected to grow by less than 2% p.a. over the Outlook, compared with over 6% p.a. over the past 20 years.
• Part of this slowing reflects an easing in economic growth: annual GDP growth averages close to 5% p.a. over the Outlook, around half the average pace of growth since 2000.
• The slowing also reflects continuing sharp declines in energy intensity as economic activity within China gradually shifts away from energy-intensive industrial output towards more energy-light consumer and services activity, and policies drive further improvements in energy efficiency.
• China’s energy intensity declines by 3% p.a. over the Outlook - significantly quicker than the projected global average - converging on US levels by 2035.
• 중국은 세계 최대의 에너지 소비국이며 가장 중요한 국가입니다.
지난 20 년 동안 글로벌 에너지의 성장 원천. 그러나 중국이보다 지속 가능한 성장 패턴에 적응하면서 에너지 수요가 변화 할 가능성이있다.
• 중국의 에너지 수요는 2 % p.a 감소 할 것으로 예상된다. 전망보다 6 % p.a 이상. 지난 20 년 동안
•이 둔화의 일부는 경제 성장의 완화를 반영합니다. 연간 GDP 성장률은 평균 5 % pa입니다. 전망에 따르면 2000 년 이래로 평균 성장 속도의 절반 정도가된다.
• 또한 중국의 경제 활동이 에너지 집약적 인 산업 생산에서 더 많은 에너지 가벼운 소비 및 서비스 활동으로 점차 옮겨 감에 따라 에너지 집약도가 계속해서 급격히 하락하는 것을 반영하며 정책은 에너지 효율성을 더욱 향상시킵니다.
• 중국의 에너지 집약도는 3 % p 하락한다. 전망에 비해 훨씬 빠르다. 2035 년까지 미국 수준으로 수렴한다.
China is also shifting towards a lower-carbon energy mix with coal being displaced by lower carbon alternatives

• China’s energy mix is also likely to change significantly over the next 20 years, driven by its changing economic structure and a policy commitment to move to cleaner, lower-carbon fuels.
• In particular, after providing almost two-thirds of China’s increasing energy needs over the past 40 years, China’s coal consumption is projected to broadly plateau over the Outlook.
• As a result, the share of coal in China’s energy demand falls from around two-thirds
in 2015 to less than 45% by 2035.
• Much of this reduced share is replaced by renewables, nuclear and hydroelectric power, which supply more than half of China’s increasing energy demands over the Outlook. The combined share of these fuels in China’s energy mix rises from 12% in 2015 to over 25% by 2035.
• China’s consumption of natural gas also increases sharply, with its share almost doubling over the Outlook to 11% in 2035.
• 중국의 에너지 믹스는 경제 구조의 변화와보다 깨끗하고 저탄소 연료로 전환하려는 정책적 약속에 힘 입어 향후 20 년 동안 크게 변화 할 것으로 예상됩니다.
• 특히 지난 40 년 동안 중국의 에너지 수요 증가량의 거의 3 분의 2를 제공 한 이후 중국의 석탄 소비량은 전망보다 폭넓게 안정 될 것으로 예상됩니다.
• 결과적으로 중국의 에너지 수요에서 차지하는 석탄의 비중은 약 3 분의 2
2015 년에는 2035 년까지 45 % 미만으로 감소 할 것으로 예상됩니다.
•이 축소 된 점유율의 대부분은 재생 가능 에너지, 원자력 및 수력 발전으로 대체되며, 이는 전망보다 중국의 증가하는 에너지 수요의 절반 이상을 공급합니다. 중국의 에너지 혼합에서 이러한 연료의 합계 점유율은 2015 년 12 %에서 2035 년 25 % 이상으로 증가합니다.
• 중국의 천연 가스 소비량 또한 급격히 증가하며, 2035 년에는 점유율이 11 %로 거의 두 배가됩니다.
[재테크] - BP 2017 에너지전망(+ Welcome to the 2017 edition of BP’s Energy Outlook)
[재테크] - BP 2017 에너지전망(+ Base case: Primary energy)
[재테크] - BP 2017 에너지전망(+ oil fuel by fuel detail)
[재테크] - BP 2017 에너지전망(+ Natural gas fuel by fuel detail)
[재테크] - BP 2017 에너지전망(+ key issue)
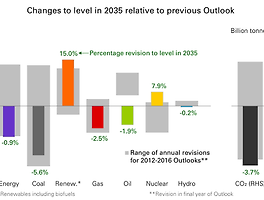
[재테크] - BP 2017 에너지전망(+ Main revision)
[재테크] - BP 2017 에너지전망(+ Key uncertainties)
[재테크] - BP 2017 에너지전망(+ Beyond 2035)
[재테크] - BP 2017 에너지전망(+ Annex)
'Energy' 카테고리의 다른 글
| BP 2017 에너지전망(+ Key uncertainties) (0) | 2018.02.08 |
|---|---|
| BP 2017 에너지전망(+ Main revision) (0) | 2018.02.07 |
| BP 2017 에너지전망(+ Natural gas fuel by fuel detail) (0) | 2018.02.05 |
| BP 2017 에너지전망(+ Coal, Nuclear and hydro, Renewables) (0) | 2018.02.04 |
| BP 2017 에너지전망(+ oil fuel by fuel detail) (0) | 2018.02.04 |